



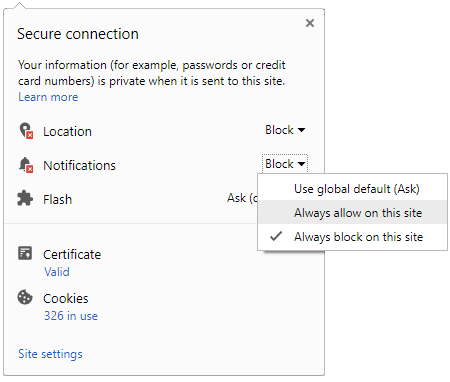
 Click it and Unblock the Notifications
Quarterly Results of Sun Pharmaceutical Industries Ltd. Company (Figures in Rs crores)
| Sep 30, 2026 | Jun 30, 2026 | Mar 31, 2026 | Dec 31, 2025 | Sep 30, 2025 | |
|---|---|---|---|---|---|
| Net Sales / Income | 6,141.92 | 5,741.13 | 4,923.88 | 5,687.77 | 4,548.11 |
| Other Income | 81.01 | 140.17 | 62.93 | 179.90 | 72.79 |
| Net Profit/Loss | 871.29 | 1,115.14 | 608.70 | 705.44 | 564.22 |
| Raw Material | 1,660.44 | 1,239.74 | 1,228.66 | 1,160.49 | 996.19 |
| Power And Fuel | 0 | 0 | 0 | 0 | 0 |
| Employee Expenses | 852 | 830.93 | 703.99 | 739.62 | 728.77 |
| Excise | |||||
| Admin And Selling Expenses | 0 | 0 | 0 | 0 | 0 |
| Research And Devlopment Expenses | 0 | 0 | 0 | 0 | 0 |
| Expenses Capitalised | 0 | 0 | 0 | 0 | 0 |
| Other Expenses | 2,258.35 | 1,725.47 | 2,007.63 | 2,098.02 | 1,624.08 |
| Provisions Made | 0 | 0 | 0 | 0 | 0 |
| Interest | 276.96 | 278.48 | 216.92 | 244.17 | 248.33 |
| Gross Profit | 1,518.78 | 1,825.90 | 1,174.98 | 1,694.33 | 1,008.05 |
| Depreciation | 315.79 | 307.92 | 325.97 | 338.53 | 336.30 |
| Taxation | 331.70 | 379.24 | 215.02 | 482.06 | 107.53 |
| Extra Ordinary Item | 0 | -23.60 | -25.29 | -168.30 | 0 |
| Prior Year Adjustments | 0 | 0 | 0 | 0 | 0 |
| Equity Capital | 239.93 | 239.93 | 239.93 | 239.93 | 239.93 |
| Equity Dividend Rate | 0 | 0 | 0 | 0 | 0 |
| Agg.Of Non-Prom. Shares (in lacs) | 0 | 0 | 0 | 0 | 0 |
| Agg.Of Non PromotoHolding(%) | 0 | 0 | 0 | 0 | 0 |
| EPS (in Rs.) | 3.63 | 4.65 | 2.54 | 2.94 | 2.35 |
Disclaimer: This is 3rd Party content/feed, viewers are requested to use their discretion and conduct proper diligence before investing, GoodReturns does not take any liability on the genuineness and correctness of the information in this article

 Sign in with Google